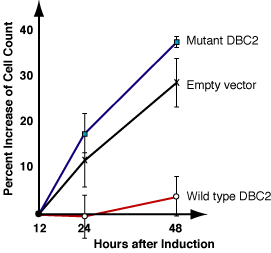
We demonstrated that DBC2 is not a mere mutation suppressor but a tumor suppressor.
- Wild type DBC2 suppresses growth of breast cancer cells.
- Naturally occurring DBC2 mutants fail to hinder tumor growth.

We are performing three tasks in functional analysis of DBC2.
1. Functional analysis of RAS domain
2. Isolation of proteins that interact with DBC2
3. Studying effects of DBC2 expression on RNA profiles

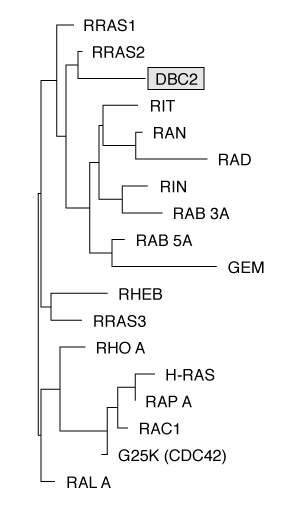
Figure 2. A phylogenic tree demonstrating overall homology between RAS proteins. Similarity of DBC2-RAS to other RAS proteins is calculated by a distance analysis. The length of a horizontal line is proportional to estimated divergence along each branch. The data suggest that DBC2 is closest to RRAS.

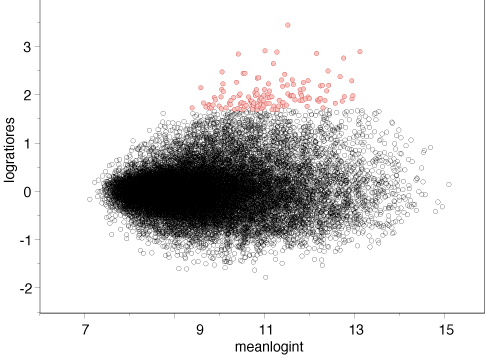
Figure 3. Expression microarray analysis. Expression levels of 46,000 genes were compared between presence and absence of DBC2. The X-axis indicate abundance of each gene. The more right, the more heavily the gene is used. The Y axis is changes of expression level indicated by ratio in log (base=2). THe higher the dot is, the larger the cahnge of gene expression is. The red dots represent genes that are upregulated by DBC2 by more than three folds. The data indicate that DBC2 directly or indirectly regulates how these genes are used in cells.